What Engagement Rate Doesn't Tell You About Your Social Reports
Brett Dashevsky
Amy Watts
Table of Contents
No headings found
Published
/
4 min read
TL;DR:
Engagement rate treats a confused, angry, or mocking audience exactly the same as an admiring one - the number goes up either way. Comment data is what actually tells you which one happened, and it's the piece most social reports leave out.
Every social report runs into the same wall eventually. Reach, impressions, engagement rate, and then a sentiment score sitting at the bottom that nobody really knows what to do with.
That score might tell you how people felt overall, but it doesn't tell you what they actually said, why they said it, or what a team is supposed to do next. For that, the comments are the only place to look.
Engagement rate vs. sentiment score
These two numbers get treated as a matched pair in most reports, but they're measuring completely different things.
Engagement rate measures volume: the share of people who liked, commented, shared, or saved a post relative to how many saw it. It's a measure of how much activity happened.
Sentiment score measures tone: whether that activity, in aggregate, skewed positive, negative, or neutral. It's a measure of how the activity felt, broadly.
Engagement rate
Sentiment score
What it measures
Volume of activity relative to reach
General tone of that activity
Answers the question
"How much did people react?"
"Did they react well or badly?"
What it can't tell you
Whether the reaction was positive or negative
What specifically people said, or why
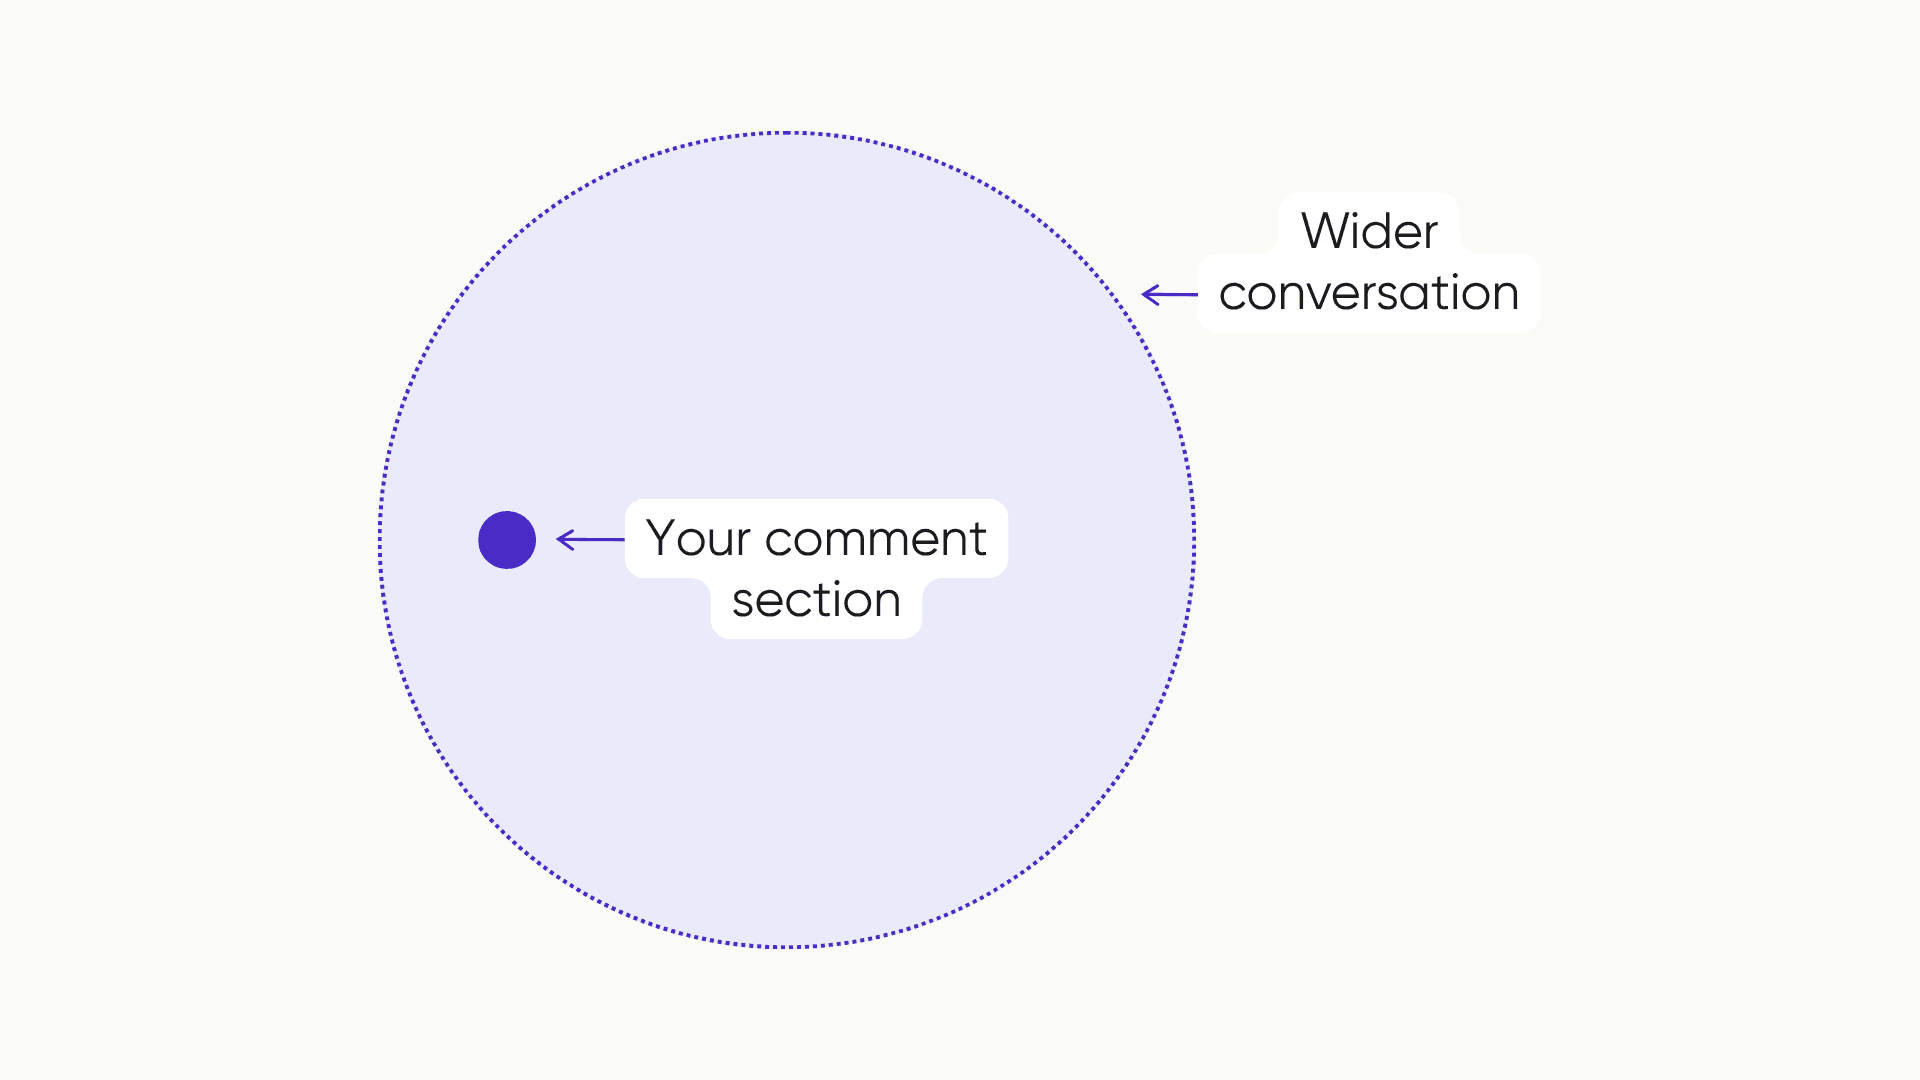
Neither number explains what's actually driving it. A post can have a high engagement rate and a strongly positive sentiment score and still be missing the specific product complaint sitting in 200 of those comments, because sentiment score reports the average tone, not the individual threads inside it. Reading the comments themselves is the only way to get past what these two numbers describe and into what they mean.
'Engagement increased X%; sentiment also increased X%.' These standalone metrics don't answer the business question. It's important to include context around what changed and why it worked.
Case study: American Eagle's "Great Jeans" campaign
In July 2025, American Eagle launched a campaign built around a pun: "Sydney Sweeney Has Great Jeans," playing on the actor's "great genes" while she stood in front of a poster crossing out "genes" for "jeans." Engagement was immediate and massive - one clip alone drew more than a million views on American Eagle's Instagram.
That engagement wasn't uniformly positive. Critics argued the wordplay, paired with Sweeney's blonde hair and blue eyes, echoed eugenics-era rhetoric about "good genes." The backlash escalated into a genuine political flashpoint - high-profile political figures weighed in publicly on both sides, turning a denim ad into a culture-war talking point almost overnight. That kind of amplification drives enormous comment volume, most of which has nothing to do with product interest.
On paper, the campaign looked like a clear win: American Eagle's leadership credited it with boosting sales and brand awareness, and the company's stock moved up in the weeks following launch. The full picture is messier than that headline suggests - some retail trackers reported a dip in foot traffic over the same period, even as online engagement stayed high. Engagement rate and top-line sales figures told a strong-performance story that other data didn't fully back up.
Then in early 2026, American Eagle brought Sweeney back for a follow-up campaign, "Syd for Short." The moment it went live, the original 2025 controversy resurfaced in its comments - more than half a year later, still active enough to attach itself to something else entirely.
What affinity actually looks like in the comments
Genuine affinity and negative engagement have different signatures, and they're visible the moment you actually read the comments rather than just the score. Affinity tends to show up as personal stories, unprompted product questions, people tagging friends, and expressions of loyalty to a brand they already admire. Negative engagement looks entirely different: mockery, corrections, competitor comparisons, open distrust.
Both can produce identical engagement rates, even though only one of them reflects real audience connection.
Turning comment data into something a report can actually use
Knowing this distinction matters only if it makes it into the report. Here's how to put it to work.
Step 1: Go deeper than positive or negative
A sentiment score might say a post skewed 83% positive. It won't say what people were actually reacting to, what language kept showing up, or what was sitting underneath the other 17%. That context is what turns a number into something a team can act on - a specific frustration, an unanticipated product question, something people loved that had nothing to do with the original brief but is worth building on anyway.
Step 2: Track what repeats, not what's loudest
A single comment is an opinion. The same sentiment showing up across hundreds of comments is a signal, and there's a meaningful difference between the two in terms of what belongs in a report. A recurring question or a conversation gaining momentum will show up in the comments before it shows up anywhere else - that pattern is worth more in a debrief than any individual comment, however dramatic.
Step 3: Turn the signal into stakeholder-ready evidence
Comments are well suited to stakeholder conversations because they're evidence. Real people, saying real things, in their own words, tends to land harder than a chart. The work is pulling out the clearest signals, grounding them in specific examples, and framing them around what they actually mean for the brand.
This is the step Siftsy is built to shortcut - surfacing the recurring themes and the clearest supporting comments automatically, instead of a team scrolling through hundreds of replies to find the three that actually prove the point.
Common questions
Can a post have high engagement and negative sentiment at the same time?
What's the difference between engagement rate and sentiment score?
How do you tell brand affinity from vanity engagement?
Reading past the numbers
A report built entirely on engagement rate and a single sentiment score leaves out the part that explains what those numbers actually mean. A team that keeps reporting on activity without reading what generated it ends up making the next campaign decision on the same incomplete evidence as the last one.
What a stakeholder actually wants from a report is usually already sitting in the comment section - it just hasn't become part of anyone's workflow yet.